GLIAG · SUBSURFACE SCIENCE
Charge Architecture of the Guyana Suriname Basin
A quantitative kitchen through time synthesis of source provenance fluid phase migration and petroleum available
Drs. Marcel P.T. Chin-A-Lien, MBA, M.Sc., Ing. Geologist
AAPG Certified Professional Geologist 5201-1996 | EurGeol 92-1996 | AIEN Energy Negotiator
GLIAG Subsurface Science | 5 October 2026 | GLIAG-GSB-CA-2026-1005-001 | Revision 1.0
Abstract
This paper reconstructs the Guyana-Suriname Basin as a time-dependent charge architecture rather than a collection of licence blocks. It integrates the Albian-Cenomanian-Turonian marine source complex, the proven Late Aptian interval and lower-confidence older source candidates with maturity, phase, expulsion, migration, trapping and preservation. The synthesis joins two quantitative but non-equivalent GLIAG models. The anchored GIP Rev 0.22.33 screening model calculates 1,307 billion barrels of oil equivalent generated across 122,906 square kilometres of Suriname offshore: approximately 1,056 billion boe from ACT and 253 billion boe from Aptian, partitioned into 1,086 billion barrels of oil, 46.7 billion barrels of condensate and 1,011 trillion cubic feet of gas. The separate SE Golden Lane sector mass balance calculates 1,455 billion boe generated across 22,000 square kilometres, 949 billion boe expelled, about 172 billion boe trapped in place and 73.3 billion boe recoverable under explicit scenario efficiencies. These are modelled screening quantities, not reserves. Their scientific value lies in the auditable source-to-accumulation ledger and in predictions that can be tested against fluids from Stabroek, Block 58 GranMorgu, Block 52 and the SE Golden Lane. The resulting interpretation is a dual oil-gas-condensate province in which fluid phase is controlled by source facies, cumulative thermal stress, retained-oil cracking, migration distance, reservoir pressure and trap history. The paper also corrects the recurrent Block 28 misidentification: the 2020 Suriname discoveries discussed in that context belong to Block 58 unless a specific historical licence dataset is intended.
Executive summary
The decision opportunity. The Guyana-Suriname Basin is moving from frontier discovery into simultaneous exploration, appraisal, development, gas monetisation and sovereign-value decisions. At that stage, isolated maps and static databases are no longer enough. Decision makers need one defensible line of sight from source-rock quality and kitchen maturity through migration, reservoir, fluid phase, pressure, development timing, economics and national value. This paper demonstrates that integrated line of sight: it converts a 122,906 square kilometre offshore petroleum-system model into time-dependent, source-specific and phase-specific decision intelligence while keeping observations, assumptions and uncertainty visibly separate.
Why it matters to explorationists and investors. For explorationists, the architecture identifies where ACT and Aptian charge may overlap, why oil grades into condensate and gas, when traps became chargeable and which new observation would falsify the preferred model. For investors and senior decision makers, it prevents a costly category error: generated petroleum is not automatically expelled, trapped, recoverable or commercial. The same auditable ledger that quantifies geological upside also exposes the conversion losses, dependencies and evidence gaps between a prolific kitchen and investable barrels.
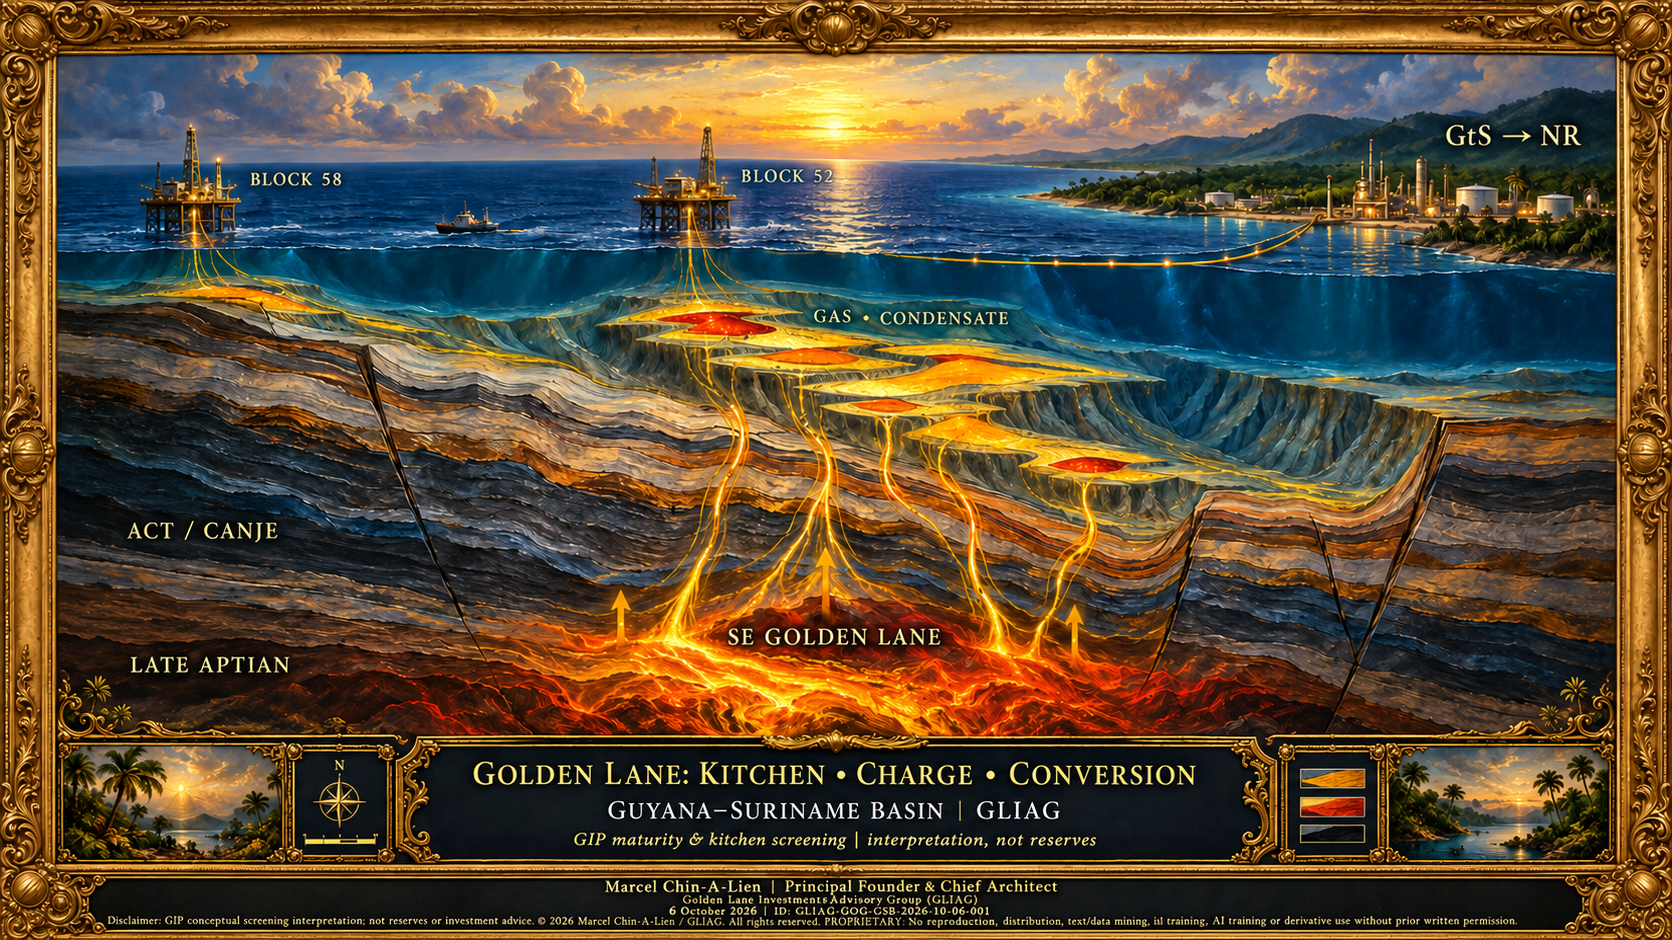
The latest GIP/KMM-01 top-ACT maturity surface adds a basin-scale test of that architecture: at screening grade, it places the mature ACT belt beneath the Stabroek–Canje–Corentyne–Block 58–Block 52 discovery corridor. This supports the working interpretation of the Golden Lane as both the principal ACT kitchen and its principal receiver, while the map remains a maturity view rather than a charge or reserves map. Expelled mass, deeper source intervals, migration pathways and discovered volumes must be integrated before that interpretation is treated as demonstrated cell by cell.
For Suriname, this geology also creates a strategic conversion question: if additional gas and condensate are confirmed in the Block 58–Block 52 fairway, how can they support reliable domestic power, industry and liquids supply? GtS and a modern refinery (NR) are commercially relevant routes to test, provided GIP separates contracted supply from exploration upside and evaluates delivery timing, infrastructure, offtake, price, fiscal terms and financing together.
The GIP advantage. GIP is being developed as GLIAG’s rapid, holistic intelligence environment for precisely this class of decision. It connects a trusted and continuously curated input base – official agency and operator disclosures, wells and fluids, peer-reviewed literature, basin models, seismic and map control, GLIAG research and registered predictions – to subsurface, engineering, commercial, fiscal, policy and sovereign-value modules. Users can interrogate provenance, change assumptions, compare scenarios and see the consequences propagate from kitchen through time to petroleum available and economic relevance. Its differentiator is not data volume alone, but disciplined integration: regional depth, transparent evidence, fast updating and a traceable path from geological observation to executive action. The platform is approaching commercial introduction for organisations that require an independent, regionally grounded decision system rather than another static information feed.
Technical legal and proprietary notice
IMPORTANT TECHNICAL AND LEGAL NOTICE. This publication is an independent GLIAG scientific interpretation assembled from identified public sources, author research and explicitly labelled screening models. It is not an operator reserves report, a PRMS classification, a competent-person report, a prospectus, investment advice, legal advice, drilling instruction or assurance of discovery or commerciality. Generated, expelled, migrated, trapped, recoverable and produced petroleum are different quantities and must not be interchanged. Model outputs are conditional on the stated geometry, rock properties, kinetics, transformation ratios, phase rules and efficiency assumptions. Confidential well, seismic, PVT and laboratory data may materially change the results. No value in this paper may be used as a well-control parameter or booking quantity without independent professional verification and access to the governing data.
COPYRIGHT AND PROPRIETARY RIGHTS. Copyright 2026 Marcel P.T. Chin-A-Lien and GLIAG Intelligence B.V. All rights reserved. Public availability does not waive ownership. To the fullest extent permitted by law, no part of the original analysis, model logic, selection and arrangement of data, tables, figures or prose may be reproduced, republished, translated, sold, redistributed, systematically extracted, incorporated into a database, used to create derivative models, or ingested for machine learning, artificial-intelligence training, fine-tuning, retrieval-augmented generation, embedding, benchmarking or dataset construction without prior written licence from the rights holders. Limited quotation is permitted only where allowed by applicable law and must identify the author, GLIAG, title, date and canonical URL. Third-party works remain the property of their respective owners.
1 The conclusion before the method
The most defensible regional interpretation is not a single-source cartoon and not a catalogue of discoveries. It is a charge architecture: source rocks of different ages and facies enter successive maturity windows, expel different phase proportions, access different carrier systems and encounter traps whose capacity and seal history vary through time. The architecture predicts an oil-dominant central and western producing core, a volatile-oil to condensate transition, and gas-rich sectors where cumulative thermal stress, retained-oil cracking and pressure-volume-temperature behaviour push the charge beyond ordinary black oil.
The GLIAG working thesis is that the ACT or Canje-equivalent marine engine supplies the dominant regional charge, while the Late Aptian system adds a second, spatially distinct contribution and older Barremian or Tithonian sources remain testable but unproven. This is not a claim that every accumulation is uniquely sourced or that every block shares the same mixing ratio. It is a model that makes measurable predictions about source age, fluid family, maturity, gas-to-oil ratio, API gravity, migration direction and charge timing.
The decisive advance is to keep the petroleum ledger open. GIP can calculate generation through time for every model cell, preserve the input and evidence attached to each cell, separate oil, condensate and gas, and compare predicted phase with observed fluids. It can then carry the model forward from generated petroleum to expulsion, migration, trap access and petroleum available, while retaining competing scenarios instead of forcing a single deterministic answer.
2 Evidence hierarchy and claim discipline
This paper uses four evidence classes. Tier 1 consists of measured observations: stratigraphic picks, core and cuttings analyses, Rock-Eval data, biomarker or isotope measurements, pressure and PVT data, drill-stem tests and flow tests. Tier 2 consists of operator or agency disclosures whose underlying data are not fully public. Tier 3 consists of calibrated models, including GIP and third-party basin models. Tier 4 consists of GLIAG interpretation and forward prediction. A strong technical argument does not hide these differences; it uses them to show exactly how much weight each conclusion can carry.
A model number is not weakened by being labelled correctly. The GIP totals are valuable because their assumptions are visible and editable, their arithmetic closes, and their time slices can be tested. They are not reserves because no discovery inventory, economic limit, development plan or PRMS classification converts generated mass into booked volumes. The SE Golden Lane recoverable scenario is likewise a charge-constrained exploration scenario, not a reserves audit. Its purpose is to quantify the consequences of a stated set of efficiencies.
3 The stacked source system
The ACT Canje marine engine
The principal source interval is the organic-rich Albian-Cenomanian-Turonian complex, expressed regionally as ACT, A3CT, ACTC or Canje-equivalent depending on the stratigraphic scheme. Public and GLIAG compilations place typical oil-prone marine values in a broad envelope of about 4 to 15 weight percent TOC and 400 to 700 milligrams hydrocarbon per gram TOC. GIP Rev 0.22.33 uses zoned values derived from the GLIAG source-rock work; its earlier uniform control case used 100 metres net source, 4 percent TOC and HI 580. These are modelling inputs, not basin-wide measurements [1, 2, G1, G2].
The Demerara Rise cores provide unusually strong depositional calibration. DSDP Site 144 reported laminated Cretaceous black shales with TOC reaching about 30 percent, while ODP Leg 207 reported peaks near 29 percent and average values of roughly 6.6 to 7.9 percent in key intervals. These immature cores demonstrate source richness and anoxic preservation at the sampled locations. They do not, by themselves, map net thickness or maturity beneath every discovery [3, 4].
The Late Aptian engine
The Late Aptian interval is treated as a proven but less completely mapped source system. The Rev 0.22.32 control case used 50 metres net source, 3 percent TOC, HI 450 and presence in 32 percent of the domain. Rev 0.22.33 replaces that uniform coverage with six zones derived from the GLIAG Aptian essay. The author dataset defines 57,500 square kilometres gross and 18,165 square kilometres effective Aptian area. The resulting zoned GIP contribution is approximately 253 billion boe generated, compared with about 1,056 billion boe for ACT [G2, G3].
Older source candidates
Barremian and Tithonian intervals remain lower-confidence candidates. They are supported by seismic, conjugate-margin analogy and deep-rift logic, but public evidence does not justify assigning them the same status as the ACT and Late Aptian systems. The correct treatment is scenario-based: define presence, organofacies and kinetic priors; calculate what each source would predict; and require a fluid or well observation capable of falsifying the contribution. GIP leaves the Albian unquantified where the necessary thickness, TOC, HI and area parameters are missing. That refusal to invent a number is a scientific strength.
4 Kitchen through time modelling
For source interval s, cell c and time step t, the GIP generation calculation can be written as:
Delta G s,c,t = A c times h s,c times rho s times TOC s,c times HI s,c times Delta TR s,c,t times C
where area, net source thickness, density, organic-carbon fraction, original hydrogen index, incremental transformation ratio and unit-conversion factor are explicit. Summing cells and time steps yields cumulative generated petroleum. This is mass bookkeeping. It becomes a petroleum-system model only when burial history, heat flow, kinetics, expulsion, migration and preservation are independently constrained.
The anchored Rev 0.22.33 model covers 122,906 square kilometres of Suriname offshore. It assigns every grid cell to one of six ACT zones and one of six Aptian zones, carries zoned net thickness, TOC, HI and presence, calculates transformation through time, and partitions product into oil, condensate and gas according to the maturity state at generation. The model can display total generation, each phase, dominant phase, source potential, source zones and cell-level output through time [G2, G3].
The phase rules are grounded in the GLIAG fluid-evolution work: light oil at approximately 0.6 to 0.9 percent Ro, volatile oil at 0.9 to 1.1 percent Ro, gas-condensate at 1.1 to 1.4 percent Ro and dry-gas tendency above roughly 1.4 to 1.6 percent Ro. The control formulation assumes that 35 percent of generated oil remains in the source and can crack between about 1.1 and 2.0 percent Ro. That mass-preserving transfer explains why late condensate and gas can emerge from an initially oil-prone Type II system. Licensed kerogen and oil-cracking kinetics are still required for calibration [G2, G3, G5].
5 Quantitative GIP result
At present day, the anchored zoned model reports 1,307 billion boe generated across Suriname offshore. Approximately 1,056 billion boe is attributed to the ACT system and 253 billion boe to Aptian. The phase ledger contains 1,086 billion barrels of oil, 46.7 billion barrels of condensate and 1,011 Tcf of gas. Using the model conversion, the gas contribution is about 174 billion boe; rounding explains small differences between component sums and the reported total [G2, G3].
Generation is strongly time dependent. The model reports 302 billion boe generated by 50 Ma, 707 billion boe by 30 Ma, 878 billion boe by 20 Ma and 1,307 billion boe at present day. Thus about 23 percent of the present model total existed by 50 Ma, 54 percent by 30 Ma and 67 percent by 20 Ma. The remaining third is a late contribution capable of changing fluid phase, GOR and charge order in traps that were already formed.
These totals must be read at their proper scale. They quantify generated petroleum under zoned screening assumptions across all Suriname offshore. They do not equal expelled petroleum, petroleum that reached a trap, in-place accumulation, recoverable resource or reserves. The model is incomplete with respect to mapped deepwater net source and cell-level TOC and HI measurements, time-dependent expulsion, calibrated cracking and coke yield, Guyana volumes and licensed kinetics. Those omissions define the next work rather than invalidating the present arithmetic.
Table 1 Anchored GIP Rev 0.22.33 generation through time screening result
| Metric | 50 Ma | 30 Ma | 20 Ma | Present day |
|---|---|---|---|---|
| Cumulative generated bn boe | 302 | 707 | 878 | 1,307 |
| Share of present total | 23% | 54% | 67% | 100% |
| ACT contribution bn boe | about 1,056 | |||
| Aptian contribution bn boe | about 253 | |||
| Oil billion bbl | 1,086 | |||
| Condensate billion bbl | 46.7 | |||
| Gas Tcf | 1,011 |
Source: GLIAG GIP PS and MB Modelling Explanation Rev 0.22.33 and Main Audit section 73 to 74. Screening model; not reserves.
6 From generated petroleum to petroleum available
The source-to-accumulation cascade is:
Generated times expulsion efficiency times migration access times trap fill and seal times preservation times recovery = recoverable scenario
Every factor is conditional and correlated. A mature source can fail commercially because expulsion is inefficient, the carrier bypasses the trap, the trap formed too late, the seal leaks or the fluid is technically uneconomic. Conversely, a moderate kitchen can fill a large connected reservoir where timing and access are favourable. GIP should therefore report a ledger rather than a single resource number: generated, expelled, migrated into the catchment, trapped in place, petroleum available at the effective date, discovered, recoverable and produced.
The SE Golden Lane scenario applies that cascade to a defined 22,000 square kilometre mature ACT sector comprising a 4,000 square kilometre deep-axis over-mature core, a 6,500 square kilometre Golden Lane belt, a 5,500 square kilometre outer-shelf oil kitchen, a 4,000 square kilometre inboard mature edge and a 2,000 square kilometre nearshore margin. Scenario UEP values are 115, 85, 55, 30 and 10 MMboe per square kilometre respectively; assumed source-expulsion efficiencies are 75, 70, 55, 40 and 15 percent [G4].
That model yields a cascade of 1,455 billion boe generated, 949 billion boe expelled, approximately 171.7 billion boe trapped in place and 73.3 billion boe recoverable. The recoverable phase split is 26.2 billion boe oil, 17.9 billion boe condensate and 29.3 billion boe gas. The scenario assumes trap efficiencies of 15 percent for the deep axis, 22 percent for the Golden Lane belt, 18 percent for the outer shelf, 10 percent for the inboard shelf and 5 percent for the nearshore margin. Those efficiencies are hypotheses to calibrate, not measurements [G4].
The all-offshore GIP total and SE-sector mass balance must not be added or treated as duplicate confirmations. They use different spatial domains, gridding and parameterization and answer different questions. The first is a generation-through-time screening model. The second is a sector charge cascade with assumed expulsion, trap and recovery efficiencies. Their comparable order of magnitude is useful, but reconciliation requires common polygons, common source properties and a cell-by-cell calculation.
Table 2 SE Golden Lane source to recoverable scenario
| Ledger stage | Model quantity | Meaning |
|---|---|---|
| Generated | 1,455 bn boe | Hydrocarbon mass generated in the 22,000 sq km sector |
| Expelled | 949 bn boe | Modelled mass leaving source rock |
| Trapped in place | 171.7 bn boe | Charge retained in scenario traps |
| Recoverable | 73.3 bn boe | Scenario recovery from trapped volumes |
| Recoverable oil | 26.2 bn boe | Phase-partitioned scenario |
| Recoverable condensate | 17.9 bn boe | Phase-partitioned scenario |
| Recoverable gas | 29.3 bn boe | Phase-partitioned scenario |
Source: GLIAG SE Golden Lane mass-balance model. All post-generation efficiencies are scenario assumptions and require calibration.
7 Fluid evidence and source provenance
Central Stabroek oil core
Liza and the central Stabroek developments demonstrate a highly effective light-oil petroleum system in stacked Upper Cretaceous deepwater reservoirs. Public production architecture proves deliverability and reservoir scale, but public source attribution remains less complete than proprietary operator geochemistry. The highest-confidence regional interpretation is charge from the mature Canje or ACT-equivalent marine system, potentially modified by mixing, migration fractionation and reservoir processes. AAPG-level attribution should be phrased as a tested working correlation unless oil-source biomarker, isotope and kinetic datasets are disclosed.
Southeastern and eastern Stabroek transition
Haimara, Longtail, Bluefin, Hatchetfish and related discoveries define the strongest public signal of a transition toward gas-condensate and retrograde-fluid development. Haimara-1 encountered about 63 metres of gas-condensate-bearing sandstone at a reported total depth of 18,289 feet in 4,590 feet of water. Public project reporting for Longtail has cited development concepts up to 1.5 bcfd gas, 290,000 barrels per day of condensate and as many as 60 production and injection wells. These project-scale values are design disclosures, not proved reserves, but they are consistent with a mature, high-GOR charge domain [8, G6].
Block 58 and GranMorgu oil anchor
Block 58 supplies the Suriname oil calibration. GranMorgu, centred on Sapakara and Krabdagu, was sanctioned with an approximately US$10.5 billion investment, a 220,000 barrel-per-day FPSO and more than 750 million barrels of gross recoverable oil reported by the partners. Published well information used in the GLIAG sector model places Sapakara and Krabdagu fluids broadly in the mid-30 degree API range, while Kwaskwasi and Maka illustrate lighter and more condensate-rich behaviour. The sector model interprets that sequence as increasing maturity and GOR within one dominant ACT charge family, but proprietary fluid typing is required to prove uniqueness [9, 10, G4].
Block 52 mixed-fluid calibration
Block 52 is the critical Suriname phase-transition laboratory. Sloanea is a commercial gas field; Roystonea provides an oil control; Fusaea encountered multiple oil- and gas-bearing Campanian sandstone packages about 170 kilometres offshore and 9 kilometres east of Roystonea. The coexistence of gas, oil and mixed pay within one block falsifies any simple block-scale phase label. It demands a model that can vary maturity, source contribution, reservoir pressure and migration history inside the licence [11, 12, G5].
The most economical provenance hypothesis is a thermally continuous ACT-dominant system grading from oil to volatile oil, condensate and gas, with a spatially variable Aptian contribution. The strongest falsifier would be a reproducible geochemical separation: for example, source-specific biomarkers or compound-specific isotopes showing that the gas-condensate domain requires a different source facies rather than greater maturity or secondary cracking of the same family.
Golden Lane and SE Golden Lane
The Golden Lane is treated here as a petroleum-system fairway, not a legal boundary. The GLIAG six-pseudo-well thermal model reports present-day Ro and transformation ratio of 1.28 and 37.1 percent for the deep-water Golden Lane position, 0.92 and 10.8 percent at AKT-1ST2, 0.89 and 8.4 percent at NCO-1, 0.69 and 0.9 percent at POP-1, 0.48 and zero at the DSDP 367 analogue, and 0.33 and zero on the immature Demerara Plateau case. The corresponding cumulative thermal stress above 100 degrees C is 1,059, 199, 123 and zero degree-C-million-years for the latter three immature cases [G4].
The model places onset of significant Golden Lane oil generation at about 70 to 65 Ma, peak expulsion from roughly 55 to 35 Ma, a critical moment near 45 Ma and a late oil to gas-condensate wave from about 30 to 10 Ma. An independent public Suriname model placed deep-kitchen generation near 55 Ma, flank generation near 34 Ma and long-distance migration toward the shelf break by about 25 Ma, with acceleration from the Late Miocene to present. The agreement is meaningful at first order, but uncertainty is at least several million years and depends on heat flow, erosion, source kinetics and horizon ages [5, G4].
Golden Lane: principal kitchen and receiver
The GIP/KMM-01 present-day top-ACT surface places a screening-grade mature belt, broadly around 0.6–1.3 percent Ro, beneath the main discovery corridor from Stabroek southeast through Canje and Corentyne to Blocks 58 and 52. Read alongside the oil-prone Stabroek and GranMorgu results, the thermal sequence and the basin’s charge timing, this supports a coherent working interpretation: the Golden Lane is not merely a receiver positioned down-migration from a remote kitchen; it overlies the principal mature ACT kitchen and receives charge over short vertical and lateral distances. The close source–carrier–reservoir relationship offers a plausible explanation for the fairway’s exceptional performance, but it remains a model interpretation, not proof that every accumulation has one source or that every grid cell delivered charge.
The distinction matters because maturity is not expelled mass and generated petroleum is not trapped petroleum. The top-ACT image does not show the hotter mid- and base-ACT or Aptian intervals, source richness and thickness, expulsion efficiency, carrier continuity, seal integrity, trap timing or retained volume. Comparable colours in eastern Suriname, the French Guiana slope and the northwestern Guyana–Venezuela corner do not establish equivalent charge or commerciality; retention, migration loss and trap timing may explain the different discovery record. The immature-looking outboard area is especially sensitive to ACT depth and heat-flow assumptions. The decision test for GIP is therefore to overlay expelled mass, mid/base-ACT and Aptian maturity, migration pathways and discovered volumes, then run depth and heat-flow sensitivities. Until those layers are reconciled, the Golden Lane conclusion is the leading, falsifiable interpretation, and the less-tested kitchens remain unresolved extension upside or charge-loss cases (GLIAG, 2026, KMM-01 Rev 0.22.80 technical note).
Gas-condensate upside and Suriname’s conversion choices
The volume evidence is substantial but must be read by model stage and domain. The anchored, zoned GIP Rev 0.22.33 model reports about 1,011 Tcf of gas generated across Suriname offshore as a whole; it does not yet isolate the generated-gas volume of the SE Golden Lane. In a separate 22,000-square-kilometre SE Golden Lane mass-balance scenario, the model carries 1,455 billion boe generated through 949 billion boe expelled and about 171.7 billion boe trapped in place to 73.3 billion boe recoverable under stated efficiencies. Its phase split includes 29.3 billion boe of recoverable gas—about 170 Tcf at the model’s conversion—and 17.9 billion boe of recoverable condensate. Those are scenario outputs, not measured gas generation, discoveries or reserves; the two model domains and methods are not additive or independent confirmation.
Even with those limits, the combined maturity and kitchen interpretation, the gas and mixed-fluid evidence in and around Blocks 52 and 58, and the large modelled gas-condensate potential justify testing a material exploration-upside case along the SE Golden Lane. The commercial implication is optionality, not a pre-booked supply promise. GtS can convert discovered and contracted gas into dependable power and industrial feedstock and reduce exposure to imported hydrocarbons. A modern refinery can convert suitable domestic crude into products for the local market, with condensate and gas evaluated as complementary liquids and process-energy streams where technically and economically appropriate. The strongest proposal stages infrastructure against a bankable base of discovered, deliverable supply, while valuing new SE Golden Lane gas and condensate as upside that can expand or extend the system. GIP should connect cell-level source maturity and phase generation to migration catchments, resource maturation, pipeline capacity, demand, prices, fiscal terms, financing and national value so that geology informs a commercially and strategically sound conversion plan.
The Block 28 correction
A secondary-market reference incorrectly placed the 2020 Suriname discoveries in Block 28. Official Staatsolie and operator records place those discoveries in Block 58. Historical maps may use a Block 28 designation, but it is not the current GranMorgu analogue. No fluid, kitchen or prospect conclusion in this paper is assigned to Block 28 without a specific historical licence map and dataset. This correction is not cosmetic: provenance begins with correct spatial identity [G7].
Table 3 Asset scale fluid and provenance interpretation
| Domain | Observed public signal | Working provenance interpretation | Confidence |
|---|---|---|---|
| Central Stabroek | Large light-oil developments | ACT or Canje dominant; mixing not excluded | High for oil system; medium for unique source |
| SE and E Stabroek | Gas-condensate and retrograde project logic | Higher-maturity ACT; Aptian or older contribution testable | High for phase; medium for source split |
| Block 58 GranMorgu | Oil-dominant Sapakara and Krabdagu | Golden Lane ACT oil window | High for fluid; medium-high for source |
| Block 52 | Sloanea gas, Roystonea oil, Fusaea oil and gas | Intra-block maturity, source mix and pressure variation | High for mixed fluids; medium for mechanism |
| SE Golden Lane | Oil to condensate to gas gradient in GLIAG synthesis | Thermally continuous ACT system with variable Aptian contribution | Model hypothesis |
| Block 28 | Misidentified in secondary data | Use Block 58 unless historical licence is specified | High |
Confidence applies to public evidence available for this synthesis; proprietary data may change attribution.
8 Migration architecture and timing
The charge model resolves two end-member migration regimes. The onshore and nearshore system is broadly hydrostatic and permits long-distance lateral migration toward the coast. Published Suriname modelling has proposed migration distances of roughly 100 to 150 kilometres from an offshore kitchen to onshore heavy-oil fields. The deep-offshore system is overpressured and more strongly controlled by vertical leakage, fault and carrier access, and stacked fill-and-spill relationships. Both regimes can coexist and change through geological time [2, 5].
Migration success requires temporal overlap between expulsion and an available trap. The critical moment near 45 Ma is important because the GLIAG reconstruction places strong ACT expulsion into already developed Upper Cretaceous and Paleogene reservoir-seal pairs. Earlier charge may be lost where traps are incomplete; later charge may displace oil, build gas caps or enter younger reservoirs. A phase map without a time axis therefore misses the mechanism that creates the observed fluid mosaic.
Pressure is part of the charge architecture, not merely a drilling parameter. Overpressure can preserve columns, focus vertical migration and support high-rate gas delivery, but pressure compartments can also isolate volumes and complicate analog transfer. GIP should connect petroleum-system results to pressure mechanism, PVT, fault-seal and geomechanical scenarios and retain P10, P50 and P90 envelopes rather than one deterministic curve [G7].
9 What GIP makes possible
The versatility of GIP lies in joining quantities that are normally scattered across separate reports. A source-zone record carries age, facies, net thickness, TOC, HI, density, kinetic family and uncertainty. A cell carries burial and temperature history, Ro, transformation ratio, generated phase and generation rate through time. A migration record carries carrier, fault, pressure regime, travel direction and timing. An accumulation record carries reservoir, seal, fluid observation, PVT, test result, in-place and recoverable classifications. Every output can remain linked to the document, page, figure, analyst and revision that produced it.
This architecture permits controlled experiments. Change the mapped Aptian presence and observe the phase and volume response. Replace uniform ACT richness with measured deepwater values. Run alternative heat-flow and erosion histories. Switch between organofacies kinetics. Apply time-dependent expulsion and oil-cracking kinetics. Compare predicted phase with the Stabroek, GranMorgu and Block 52 fluid register. The platform becomes valuable not because it draws another map, but because it records why the map changes and which evidence changed it.
The next quantitative release should extend Rev 0.22.33 in five steps: digitize source-net-thickness and TOC-HI surfaces; calibrate kinetics to released wells; compute time-dependent expulsion with retained-oil cracking and coke yield; route charge through probabilistic migration networks; and calculate petroleum available at each time slice after spill, leakage, biodegradation and trap-capacity limits. Guyana must be added on the same framework before basin-wide totals are published.
10 Registered predictions
• Prediction 1. If the ACT-dominant continuous-kitchen model is correct, API, GOR, condensate yield and maturity-sensitive biomarkers should change systematically from the Block 58 oil belt toward the Block 52 and SE Stabroek gas-condensate domains after correcting for reservoir processes.
• Prediction 2. If the Aptian contribution is material, fluids within its mapped presence should show a reproducible source-facies component that cannot be explained by ACT maturity alone.
• Prediction 3. The deepest Block 52 and SE Golden Lane positions should contain a higher proportion of condensate and thermogenic gas, while structurally shallower Golden Lane positions should retain oil-dominant charge, subject to migration and pressure compartmentalization.
• Prediction 4. Traps available near the approximately 45 Ma critical moment should show greater fill efficiency than traps whose effective seal or geometry developed after peak charge.
• Prediction 5. The Demerara Plateau ACT interval should remain immature or marginal where the public thermal model places low burial stress; a commercial thermogenic charge there would require deeper older sources, lateral charge or a revised heat-flow and burial history.
Each prediction should be frozen in the GIP ledger before the next well result is interpreted. A model earns authority by surviving adverse observations, not by being rewritten after every outcome.
11 Conclusions
The Guyana-Suriname Basin is best understood as a time-dependent, multi-source, multi-phase charge system. ACT or Canje-equivalent marine source rocks constitute the dominant proven engine; Late Aptian source rocks provide a credible second engine with a different mapped footprint; older sources remain hypotheses. The observed oil, volatile-oil, condensate and gas distribution is consistent with cumulative thermal stress, retained-oil cracking, pressure and migration history acting on those sources.
The quantitative foundation is now explicit. The anchored GIP model reports 1,307 billion boe generated across Suriname offshore, with 1,056 from ACT and 253 from Aptian, and a generation history that reaches 302 billion boe by 50 Ma, 707 by 30 Ma and 878 by 20 Ma. The separate SE Golden Lane scenario carries 1,455 generated through 949 expelled to 171.7 trapped and 73.3 recoverable under stated efficiencies. Neither result is a reserves estimate. Together they show how to move from kitchen through time to fluids, charge access and petroleum available without hiding the assumptions.
For Suriname’s energy strategy, the volumes reinforce the case to evaluate GtS and a modern refinery as linked conversion options. The basin-wide model’s 1,011 Tcf is generated gas across Suriname offshore, while the separate SE Golden Lane scenario’s approximately 170 Tcf is a recoverable-gas component under assumed efficiencies; neither is a contracted supply forecast. Together with the mature-kitchen interpretation and Block 52/58 fluid evidence, they support further appraisal of gas-condensate upside near the producing and development corridor. A bankable plan should anchor facilities and financing to discovered, deliverable volumes, then treat additional SE Golden Lane gas and condensate as phased upside. GIP’s maturity-through-time and kitchen models can test that bridge from source to migration, recoverable supply and national energy value.
The KMM-01 result sharpens the regional interpretation: the mature ACT belt appears to underlie the central discovery fairway, supporting the Golden Lane as both the principal kitchen and principal receiver. That conclusion is strongest as a short-distance charge hypothesis and fluid-phase consistency check. It is not established by %Ro alone. GIP should make it testable by joining expelled-mass estimates, the full ACT and Aptian source column, migration access, trap timing and discovery volumes, while exposing the sensitivity of deepwater cells to source depth and heat flow. This keeps the mapped maturity pattern, the interpreted charge system and the observed accumulations distinct in one auditable basin narrative.
The scientific standard is therefore higher than a conference synopsis or a deterministic sweet-spot map. Every number must retain its domain, date, unit, uncertainty, evidence tier and transformation in the ledger. Every source attribution must survive fluid correlation. Every migration path must exist at the time of charge. Every volume must state which stage of the petroleum cascade it represents. This is the discipline by which GLIAG and GIP can contribute a genuinely auditable subsurface architecture for the basin.
Annex A Quantitative provenance and limitations
GIP Rev 0.22.33 is the anchored zoned generation-through-time model. It remains a screening model. The SE Golden Lane mass balance is a separate sector scenario and is not a PRMS estimate.
Annex B Clickable external references
- Staatsolie Hydrocarbon Institute. Geology of the Suriname Guyana Basin and petroleum-system play elements. Open source
- Staatsolie. GeoAtlas of Suriname. Public basin synthesis. Open source
- DSDP Leg 14 Site 144 report. Demerara Rise Cretaceous black shales. Open source
- ODP Leg 207 Initial Reports and Scientific Results. Demerara Rise black-shale record. Open source
- Schwarzer D and Krabbe H 2009. Source Rock Geochemistry and Petroleum System Modeling in the Guyana Basin offshore Suriname. Open source
- Shipper K Mann P and Pepper A 2026. Spatial variation in charge risk along the Guyana Suriname margin. Open source
- Cedeño A et al 2021. Source Rocks in the Guyana Basin. AAPG Memoir 123. Open source
- ExxonMobil. Guyana project and discovery information including Haimara. Open source
- TotalEnergies. GranMorgu final investment decision. Open source
- APA Corporation. GranMorgu final investment decision and resource statement. Open source
- Staatsolie. Commercial field approval for Sloanea 1 gas discovery in Block 52. Open source
- PETRONAS. Fusaea 1 oil and gas discovery in Block 52. Open source
- Pepper A and Corvi P 1995. Simple kinetic models of petroleum formation. Open source
- Pepper A and Roller C 2018. Ultimate Expulsion Potential framework. Open source
- Talukdar S Gallango O and Chin A Lien M 1986. Generation and migration of hydrocarbons in the Maracaibo Basin. Open source
Annex C Clickable GLIAG research record
- A World Class ACT Marine Source Rock System Read essay
- The Overlooked Aptian Source Rock System Read essay
- Understanding Dual Phase Petroleum Systems in Guyana Suriname Read essay
- SE Golden Lane A Dual Oil and Gas Condensate Basin Read essay
- Golden Lane Basin Fluid Evolution Insights Read essay
- The Emerging Gas Condensate System of the Guyana Suriname Basin Read essay
- GLIAG Pore Pressure Doctrine for Suriname Blocks 52 and 58 Read essay
- ACT Petroleum Systems Insights from the Guyana Suriname Basin Read essay
Annex D Copyright citation and permissions
The technical legal and proprietary notice at the beginning of this publication governs use. Preferred citation: Chin-A-Lien, M.P.T. 2026. Charge Architecture of the Guyana Suriname Basin. GLIAG Subsurface Science, Revision 1.0, 5 October 2026.