
Darcy-Scale Proof, Basin-Scale Consequence: Sapakara’s Flow Test Through Modern Well-Test Science—and the Guyana (Liza) Benchmark
By Marcel Chin-A-Lien – Petroleum & Energy Advisor – January 2026
Disclaimer: this is my own analysis. To whom it may interest or serve.
Sapakara South is not merely “successful.”
It is diagnostic.
When interpreted through the academic canon of pressure transient analysis (PTA)—derivative diagnostics, flow-regime recognition, and model discrimination— the disclosed results point toward a reservoir that is likely to become facility- and execution-limited, not rock-limited. We then test that conclusion against the closest real-world analogue: Guyana’s Liza-era appraisal and its industrial plateau outcomes.
Audience: petroleum & reservoir engineers, development planners, and investors • Focus: PTA → PVT → material balance → decline → economics (illustrative scaffolding clearly labeled) • Date: 26 Jan 2026
The one-sentence thesis
Sapakara’s restricted-rate test + Darcy-scale permeability + high initial pressure indicates a development-class reservoir where uncertainty migrates from “can it flow?” to “how fast can we industrialize plateau, manage fluids, and control capex under fiscal reality?”
Inside this article
- Investment Memo (clean, decision-ready)
- Academic frame: how to interpret well tests (what the literature actually teaches)
- Sapakara interpretation: the engineering reading of the disclosed facts
- Guyana benchmark: Liza’s published record and what it implies for comparison
- Development implications: wells, plateau, facilities
- Economics: NPV logic and price sensitivity (illustrative)
- Technical appendix: PTA/PVT/material balance/decline/econ assumptions + figures
- Sources: public + academic
Investment Memo Golden Lane, Block 58.
What’s been proven
- Restricted oil rate: ~4,800 bopd over ~48 hours (Sapakara South-1 test).
- Permeability: ~1.3–1.5 Darcy (exceptional deepwater clastic quality).
- Initial reservoir pressure: ~9,300 psi.
- Dynamic connected in-place signal: ~325–375 MMbbl STOIIP for a principal interval (operator preliminary interpretation).
- Step-out support: Sapakara South-2 indicates an additional connected in-place contribution (>200 MMbbl STOIIP, per operator statement), supporting scale and continuity.
Meaning: The reservoir has likely crossed the “commercial physics threshold.”
Value creation shifts toward facility sizing, uptime, injection strategy, and fiscal timing.
What the market should watch (value drivers)
- Plateau credibility: Can subsea + wells sustain FPSO nameplate through time?
- Fluid constraints: GOR evolution and gas handling; produced-water ramp and reliability.
- Execution risk: schedule, capex inflation control, drilling delivery cadence.
- Fiscal mechanics: PSC cash-flow timing and state participation effects can dominate NPV.
- Comparative precedent: Liza shows how appraisal confidence becomes industrial plateau only when execution is exceptional.
Integrity note: PTA/PVT raw data for Sapakara and Liza appraisal tests are not public.
The charts and “simulation outputs” in this article are illustrative scaffolding anchored to public facts and standard engineering methods—useful for understanding, not a substitute for operator models.
Academic Frame: How Modern Well-Test Interpretation Works
In the academic and SPE literature, well testing is a discipline of diagnosis, not performance theatre.
A “rate” is the least interesting number unless it is tied to the questions engineers actually need answered: transmissibility (kh/μB), skin, flow regimes, boundaries/compartments, and connected volume behavior.
The modern PTA toolbox was forged in a series of step-changes: derivative diagnostics, computer-aided interpretation, and (later) deconvolution.
1) Pressure-derivative diagnostics (Bourdet): regime recognition becomes systematic
Bourdet and co-authors formalized the practical use of pressure derivatives to identify flow regimes and boundary effects more robustly than semilog straight-line methods alone. Derivative stabilization supports confident estimation of kh and diagnosis of reservoir models (infinite-acting, boundary-dominated, dual-porosity, multilayer, etc.).
- Why it matters: A test that never reaches diagnostically useful regimes can be “high-rate” yet still low-value for development decisions.
- Key academic anchor: Bourdet et al., SPE-12777-PA (derivative method).
2) Computer-aided PTA (Horne): model discrimination, not just curve-fitting
Horne’s “computer-aided approach” captures the shift from manual type-curve matching toward derivative plots, regression, and structured workflows. The goal is to discriminate between plausible models and quantify uncertainty—precisely what appraisal and early development require.
- Why it matters: Two tests at the same rate can imply radically different developments if one reveals compartments/boundaries and the other does not.
- Key academic anchor: Horne, Modern Well Test Analysis (2nd ed.).
3) Beyond type curves (Tiab): derivative-based “direct synthesis” to reduce non-uniqueness
Tiab’s derivative-based techniques explicitly target a long-standing PTA problem: non-uniqueness and subjectivity in type-curve matching. The emphasis is on identifying characteristic points/lines on pressure and derivative plots to compute parameters without trial-and-error matching.
- Why it matters: Appraisal decisions become more defendable when interpretation is less subjective and more diagnostic.
- Key academic anchor: Tiab (1995), Journal of Petroleum Science and Engineering (pressure+derivative without type-curve matching).
4) Evolution to deconvolution (Gringarten): extracting more from imperfect tests
Later “state-of-the-art” reviews document how deconvolution and related methods can recover reservoir responses from complex rate histories, helping interpret tests that do not cleanly achieve ideal regimes—common in deepwater operations constrained by safety and facility limits.
- Why it matters for deepwater: Restricted rates and operational constraints are normal; advanced interpretation can still extract development-grade information.
- Key academic anchor: Gringarten (2008), SPE REE “From Straight Lines to Deconvolution…”
A world-class well test is one that answers development questions (connectivity + constraints), not one that chases a headline rate.
Sapakara Interpretation: What the Disclosed Results Imply (PTA logic)
Using the academic lens above, the disclosed Sapakara anchors—restricted rate, Darcy-scale permeability, and high initial pressure—support three high-confidence inferences:
(1) high transmissibility, (2) likely manageable near-wellbore impairment, and (3) an economically relevant connectivity/scale signal.
1) Transmissibility is the headline because it shifts the binding constraint
Permeability of ~1.3–1.5 D is a direct statement about the reservoir’s ability to deliver under reasonable drawdown. Once rock quality is this strong, the project’s bottlenecks typically become subsea hydraulics, completion integrity, sand control, facility capacities (oil/gas/water), and uptime.


Figure 1 — Restricted flow test + pressure build-up (illustrative scaffolding). Public anchors: ~48-hour restricted flow (~4,800 bopd) and ~9,300 psi initial pressure. The curve shape illustrates the diagnostic logic engineers extract from build-up behavior.


Figure 2 — PTA signature (conceptual). Pressure + derivative trends illustrate flow regime and boundary diagnosis. Actual interpretation requires the full gauge dataset and test schedule.
2) Connected volume inference: powerful—but not reserves
The preliminary “connected STOIIP” estimate is a dynamic inference consistent with late-time behavior supporting substantial connected drainage.
This is not a booking of recoverable reserves; it is a constraint on the subsurface uncertainty set—especially when supported by step-outs. In commercial terms, it increases confidence that early infrastructure will not be stranded on a small isolated pod.
Guyana Benchmark: Liza’s Published Record vs Sapakara’s Disclosed Signals
Public disclosure for Guyana’s early Liza appraisal is different in character from Sapakara’s: ExxonMobil’s public messaging emphasized confirmation and reservoir quality, but did not publish the same explicit permeability and restricted flow-rate figures in the announcement text. However, the public record still gives two meaningful benchmark layers: (A) appraisal confirmation logic and (B) the industrial plateau outcome.
A) Appraisal confirmation logic (Liza-2 vs Sapakara South)
ExxonMobil stated that Liza-2 encountered >190 ft (58 m) of oil-bearing sandstone in Upper Cretaceous formations and that test data were being assessed, confirming the discovery and reinforcing reservoir quality continuity. Sapakara, by contrast, published specific PTA-derived parameters (permeability) and a restricted test rate.
- Commonality: both use production testing to confirm that the reservoir is development-real, not just log-real.
- Difference: Sapakara’s disclosures enable outsiders to infer a facility-limited trajectory earlier; Liza’s public record requires reading forward into development outcomes.
B) Industrial plateau outcome (the true benchmark)
Guyana’s Liza Phase 2 public documentation describes an FPSO production capacity of approximately 190,000–220,000 bopd. ExxonMobil’s Guyana project overview similarly describes Liza Phase 2 production up to 220,000 bopd. These are not well tests—but they are the ultimate test: the translation of appraisal confidence into sustained industrial plateau.
- Benchmark insight: In high-quality Cretaceous clastics, value is realized when subsurface quality is converted into reliable plateau + high uptime.
- Implication for Sapakara: Darcy-scale permeability and strong pressure raise the probability of plateau success; execution will decide magnitude and durability.
Sapakara vs Liza: the engineer-investor synthesis
- Sapakara signal: explicit permeability + restricted-rate test implies strong transmissibility; likely facility-limited once development wells are optimized.
- Liza lesson: appraisal quality matters, but the value creation engine is execution: drilling cadence, subsea reliability, water/gas handling, and uptime.
- Shared playbook: for Guyana–Suriname margin clastics, once tests confirm high-quality reservoirs, the dominant levers become facilities + operations + fiscal timing.
Development Implications: Wells, Plateau, Facilities
For Sapakara-class rock, development becomes an optimization contest between: plateau rate, plateau duration, facility uptime, injection effectiveness, and well delivery cost. When permeability is that strong, a project rarely “runs out of rock” first; it runs into facility constraints first.
Deliverability → IPR: completion and drawdown are the real levers
A restricted appraisal test rate is not a ceiling. Development wells can be engineered for higher productivity, but must respect sand control, water/gas coning, subsea hydraulics, and long-life integrity.


Figure 3 — Illustrative IPR (Vogel). A schematic productivity relationship for a high-perm oil well. The point is the shape and what it implies for facility-limited systems.
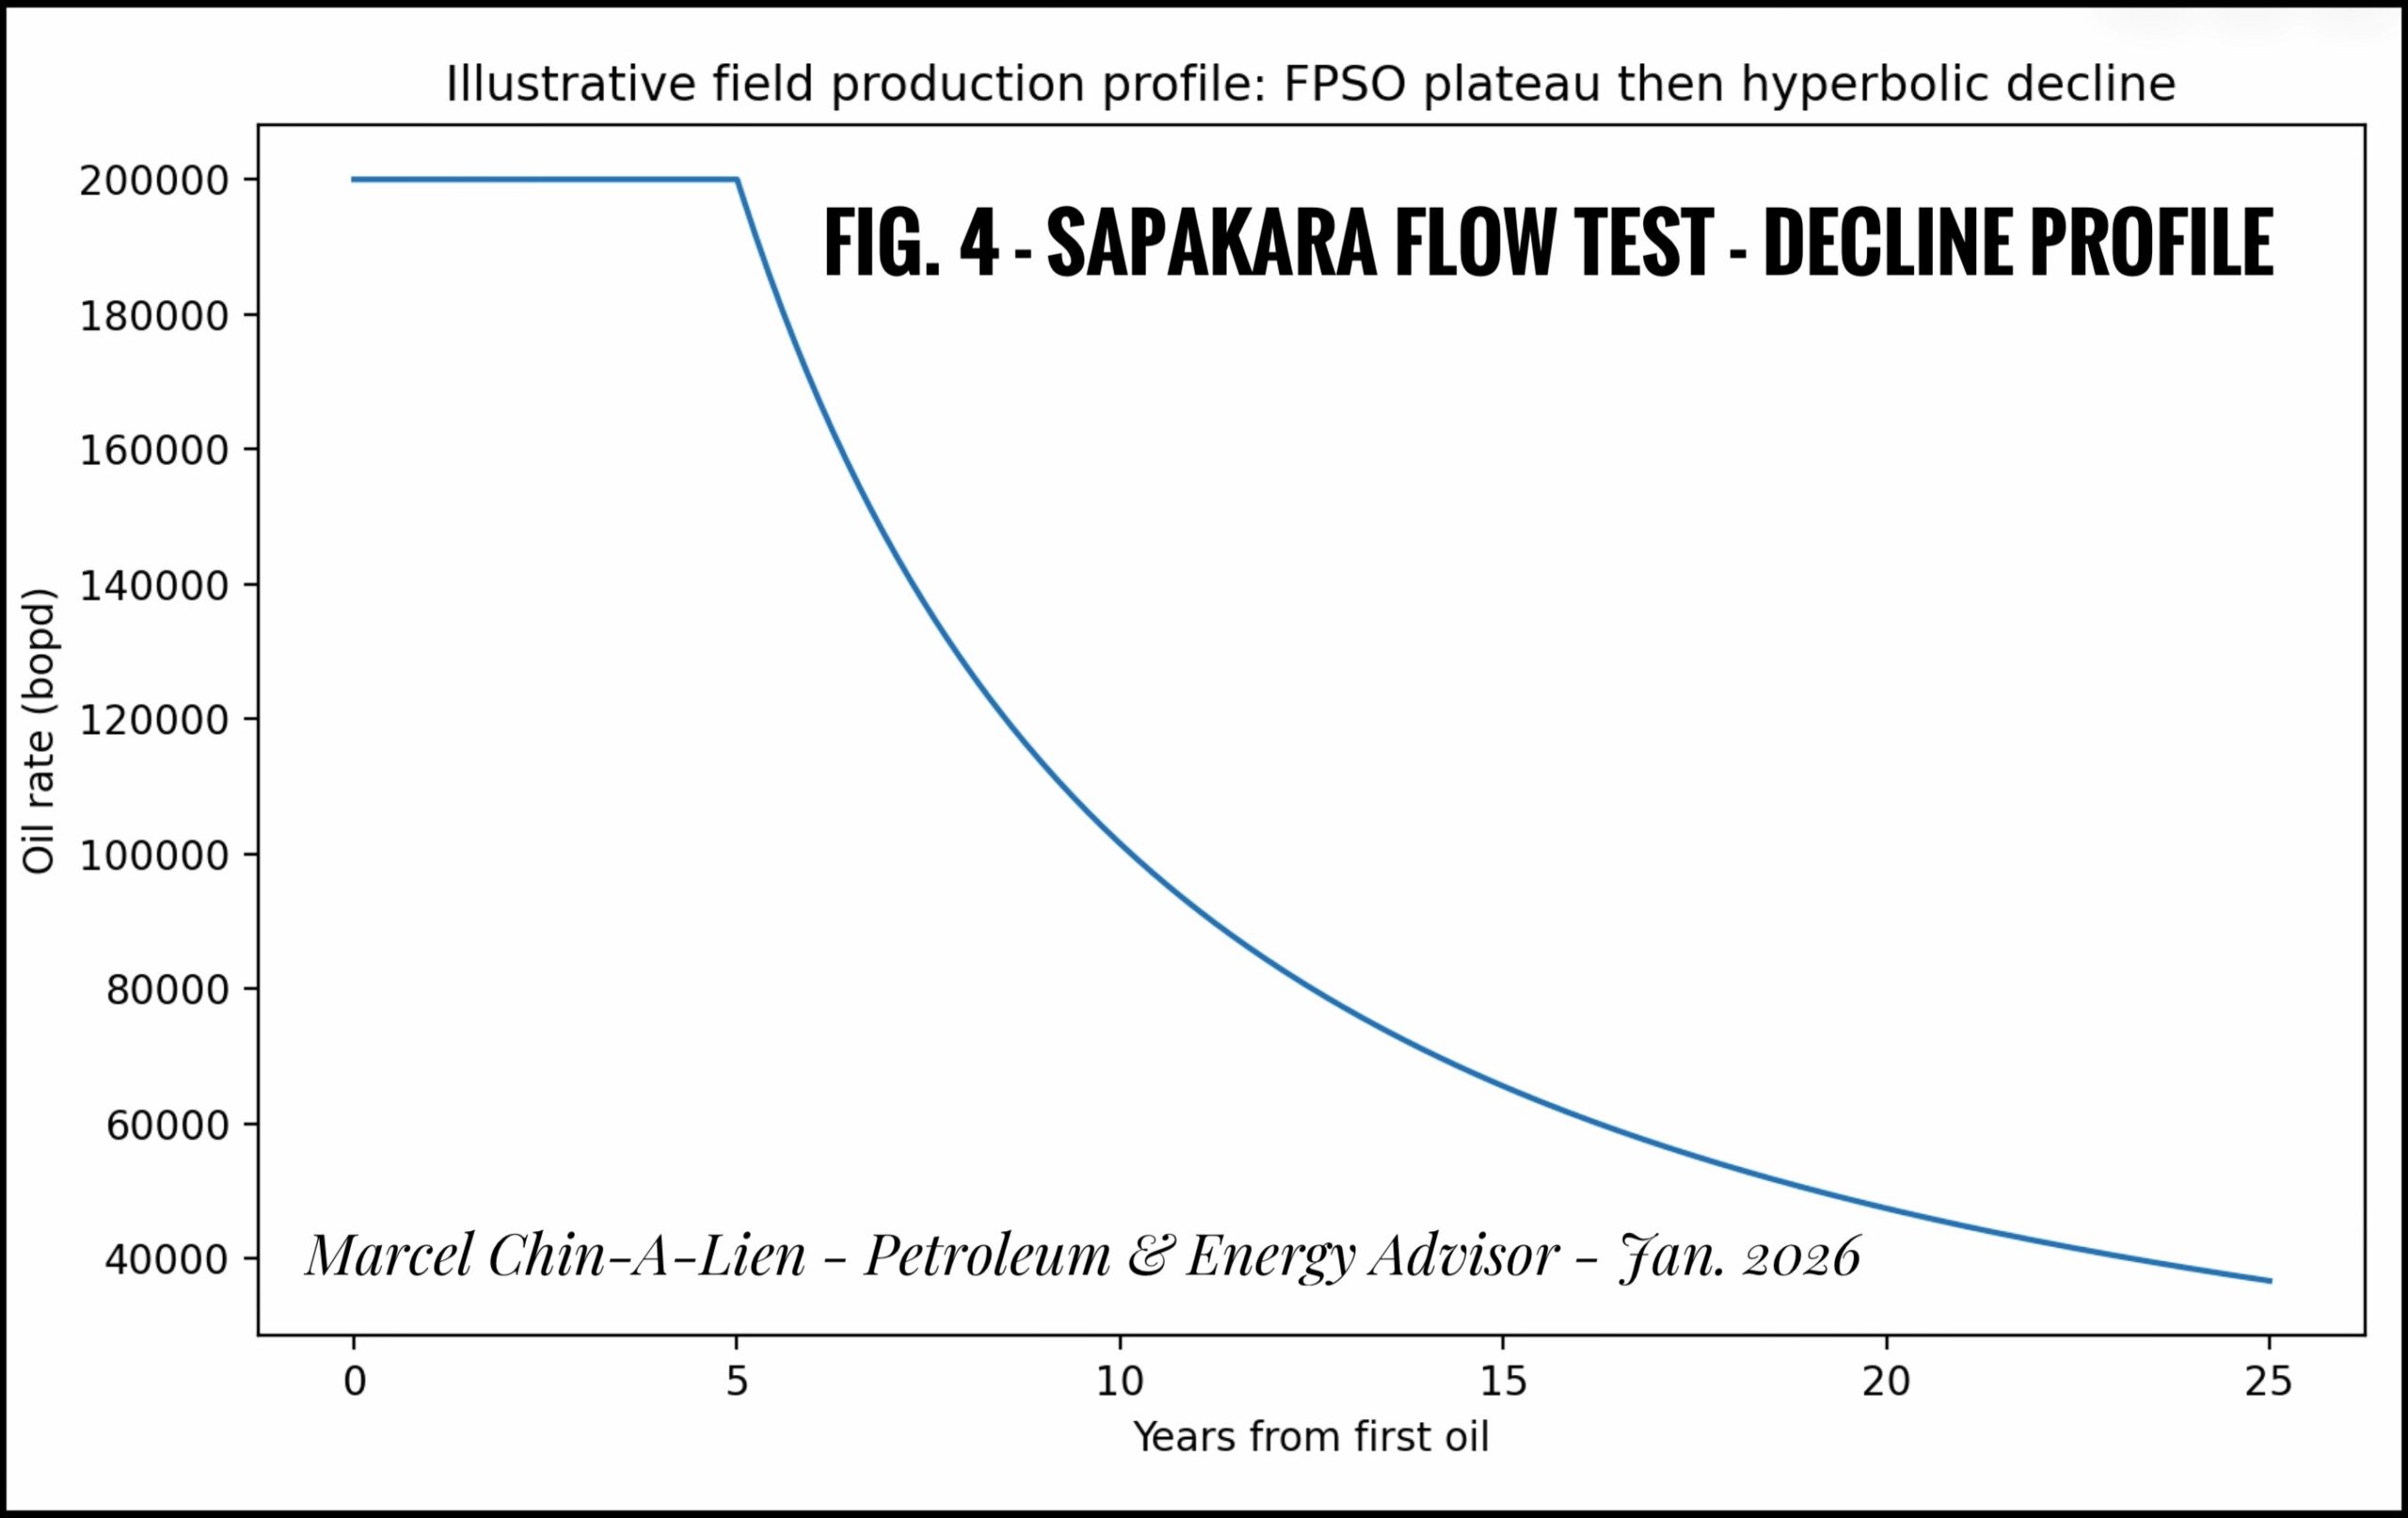
Production strategy: FPSO-shaped plateau then decline


Figure 4 — Illustrative production profile. A classic deepwater plateau followed by decline. Actual shape depends on injection, compartmentalization, and facility constraints.

Figure 5 — Illustrative cumulative production. Shows why plateau duration can dominate project value.

Economics: NPV Is a Function of Plateau, Capex Discipline, and Fiscal Timing
Deepwater economics are rarely won by geology alone. They are won by capex discipline, schedule, uptime, and fiscal timing. Public sources describe Suriname fiscal elements including a 6.25% royalty and 36% income tax, and Block 58 development cost scale exceeding US$10B. The charts below illustrate how plateau and execution translate into investor outcomes (directional, not PSC-accurate).


Figure 6 — Illustrative NPV10 sensitivity. Directional sensitivity using simplified fiscal elements and illustrative production + capex phasing (not PSC-accurate).


Figure 7 — Illustrative annual net cashflow. The deepwater signature: capex-heavy early years, then cashflow dominated by plateau sustainability and uptime.
Technical Appendix (PTA • PVT • Material Balance • Decline • Econ Assumptions)
This appendix is a reproducibility scaffold: what you would implement once full datasets are available. Where the public record ends, assumptions are labeled illustrative.
A. PTA: “what the literature says to do” vs “what deepwater allows you to do”
Design intent (Earlougher) maximize diagnostic regimes, stabilize derivative, minimize noise and wellbore storage ambiguity.
Operational reality (deepwater) restricted rates, limited test duration, safety constraints, imperfect rate histories → advanced interpretation methods (deconvolution lineage) become valuable.
- Derivative core (Bourdet): flow-regime identification and boundary diagnosis.
- Workflow core (Horne): computer-aided model discrimination and uncertainty framing.
- Non-uniqueness reduction (Tiab): derivative-based direct synthesis to avoid trial-and-error type curves.
- Advanced extraction (Gringarten): evolution toward deconvolution and extracting reservoir response from complex histories.
B. PVT (black-oil) scaffold
- Minimum: Pb, Rs(P), Bo(P), μo(P), compressibilities, separator conditions.
- Why critical here: high-perm systems become facility-constrained; PVT governs GOR handling and late-life operating envelopes.

Figure A1 — Illustrative black-oil PVT trends. Shape is representative; replace with lab data for sanction-grade modeling.
C. Material balance and recoverables
- Use case: translate “connected in-place” signals into recoverables under depletion + injection strategies.
- Sensitivities: aquifer strength, bubblepoint proximity, injection efficiency, compartments, sweep.
- Commercial consequence: recovery factor is a strategy outcome (injection + well architecture + facility constraints), not a press-release constant.
D. Decline template
- Purpose: early screening and facility thinking; reconcile later with injection, water/GOR evolution, and uptime.
Figure A2 — Decline template. Plateau then decline: the FPSO industrial signature.
E. Economics: simplified vs PSC-accurate upgrade
- Shown figures: simplified royalty + tax and illustrative capex/opex phasing.
- Upgrade: implement full PSC waterfall (cost recovery caps, profit oil splits, participation financing, abandonment).
- Deepwater truth: small changes in plateau uptime and capex timing can overwhelm many subsurface sensitivities.
Sources (public + academic)
Public Sapakara / Suriname references
- APA Corporation — Sapakara South flow test press release: APA investor relations.
- APA — supporting DST results slide with restricted rate, permeability, and initial pressure: DST Results (PDF/slide deck).
- Staatsolie — fiscal and project context: Fiscal FAQ and Block 58 development/FID context.
Guyana (Liza) benchmark references
- ExxonMobil — Liza-2 discovery statement (oil-bearing sandstone; test data being assessed): Corporate news release.
- Guyana EPA — Liza Phase 2 Project Summary (FPSO capacity ~190,000–220,000 bopd): Project Summary (PDF).
- ExxonMobil — Guyana Project Overview (Liza Phase 2 up to 220,000 bopd): Project overview page.
Academic / SPE well-test interpretation references
- Bourdet, D.; Ayoub, J.A.; Pirard, Y.M. — Use of Pressure Derivative in Well-Test Interpretation, SPE Formation Evaluation (SPE-12777-PA): OnePetro record.
- Horne, R.N. — Modern Well Test Analysis: A Computer-Aided Approach (2nd ed., Petroway): Google Books bibliographic entry.
- Tiab, D. — Analysis of pressure and pressure derivative without type-curve matching, Journal of Petroleum Science and Engineering: ScienceDirect record.
- Earlougher, R.C. Jr. — Advances in Well Test Analysis, SPE Monograph 5 (classic design & analysis foundation): Google Books entry.
- Gringarten, A.C. — From Straight Lines to Deconvolution: The Evolution of the State of the Art in Well Test Analysis, SPE Reservoir Evaluation & Engineering: OnePetro record.
Disclosure: All charts in this article are illustrative scaffolding created to explain engineering and commercial implications where full datasets are not public. Replace scaffolding with calibrated PTA/PVT + PSC-accurate economics once available.

About the Author — Marcel Chin-A-Lien
Global Petroleum and Energy Advisor
49 Years of Transformative Expertise | Exploration, Oil & Gas Giant Fields Finder – Business Development, M&A, PSC Design, Contract Strategy
Marcel Chin-A-Lien brings nearly five decades of unmatched global expertise at the highest levels of the energy sector—where technical mastery meets business acumen to unlock extraordinary value.
His career has delivered multi-billion-dollar giant field discoveries, spearheaded the iconic first capitalist upstream ventures in the USSR, shaped successful offshore bid rounds, and secured enduring cash flow streams from exploration and production activities across mature and frontier basins such as the Dutch North Sea.
An exceptional fusion of technical, commercial, and managerial insight, Marcel holds four postgraduate petroleum degrees spanning geology, engineering, international business, and management—uniquely positioning him to bridge the worlds of exploration strategy, M&A, PSC design, and contract negotiation.
Fluent in multiple languages and culturally attuned to diverse business environments, he has navigated complex geographies from Europe to Asia, Africa, and the Americas—driving innovation, de-risking investments, and aligning stakeholder interests from national oil companies to supermajors.
Whether advising on frontier basin entry, government negotiations, fiscal regime optimization, or asset valuation, Marcel’s critical insights integrate Exploration & Production with Business Development and Commercial Realism—generating sustainable growth in volatile energy markets.
Credentials and Distinctions
- Drs – Petroleum Geology
- Engineering Geologist – Petroleum Geology
- Executive MBA – International Business, Petroleum, M&A
- MSc – International Management, Petroleum
- Energy Negotiator – Association of International Energy Negotiators (AIEN)
- Certified Petroleum Geologist #5201 – AAPG (Gold Standard)
- Chartered European Geologist #92 – EFG (Gold Standard)
- Cambridge Award – “2000 Outstanding Scientists of the 20th Century”, UK
- Paris Awards – “Innovative New Business Projects”, GDF-Suez (2x Gold Awards, 2003)
Strategic Expertise
- Exploration Strategy & Giant Field Discovery
- Upstream M&A and Asset Valuation
- Production Sharing Contract (PSC) Design & Fiscal Optimization
- Government and IOC Negotiation Advisory
- Bid Round Structuring and Evaluation
- Integrated Technical-Commercial Due Diligence
For trusted advisory services at the nexus of technical excellence, commercial clarity, and geopolitical understanding, connect directly:
Public Profile: LinkedIn
Email: marcelchinalien@gmail.com
Regards, Marcel Chin-A-Lien